The Game of Thrones Effect
A couple of weeks back a question came to my mind — has the amount of nudity on television reduced? Just a few years ago, it felt like every TV show I watched had nudity, with Game of Thrones being the most extreme of the lot, containing almost pornographic levels. After GoT ended, it felt like most other TV shows toned down the (generally unnecessary) amount of nudity.
It seems that studios had an awakening that boobs aren’t going to sell bad shows, and audiences really do watch it for the plot.
I decided to put the hypothesis to the test. IMDB has a parental guide for each title where users can vote for the severity of Sex & Nudity, Violence & Gore, Profanity, Alcohol, Drugs & Smoking and Frightening & Intense Scenes.
With the IMDB dataset, and scraping the parental advisory using the Cinemagoer library, I got to work.
Game of Thrones ran from 2011-2019. I picked a date range from 2009-2022 (roughly 3 years before and after GoT). Next, I filtered shows that had at least 10k total ratings to filter only popular TV shows.
Then I assigned weights to the severity ratings that IMDB uses:
- None = 0
- Mild = 1
- Moderate = 2
- Severe = 3
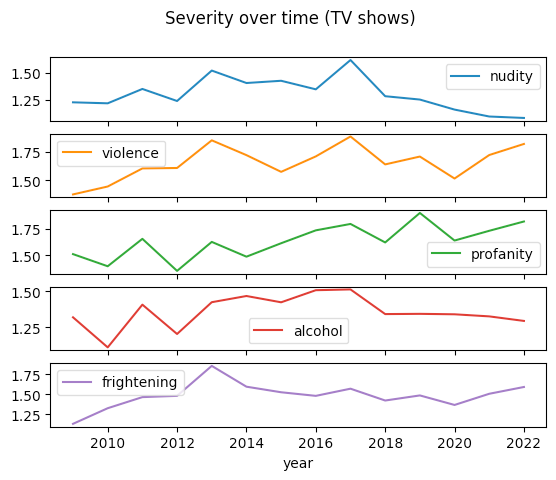
We can then calculate the weighted average of the severity of nudity/violence/profanity etc. grouped by the year that the show started airing.
Note: If you’re interested in more details, check out the Jupyter Notebook
Between 2012-2017 there was a marked increase in the severity of nudity on television, and it has been falling since then.
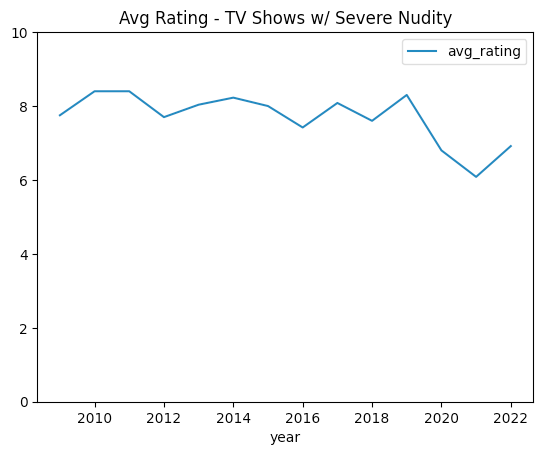
The average rating of TV shows with Severe nudity dropped after 2019.
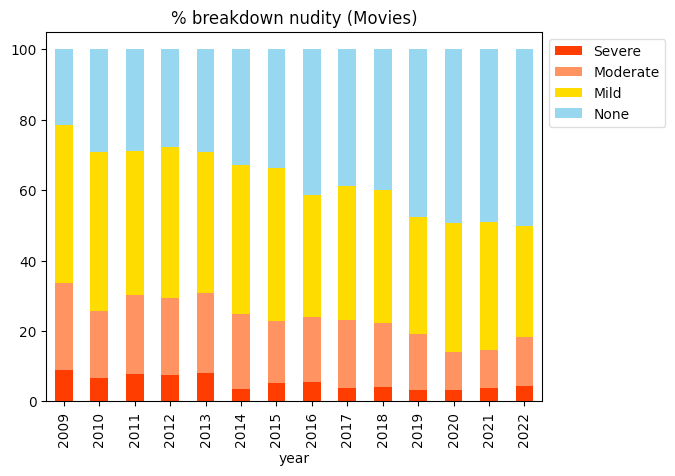
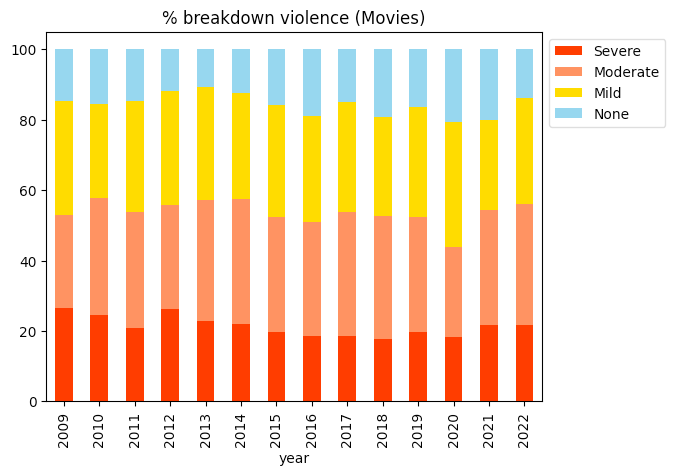
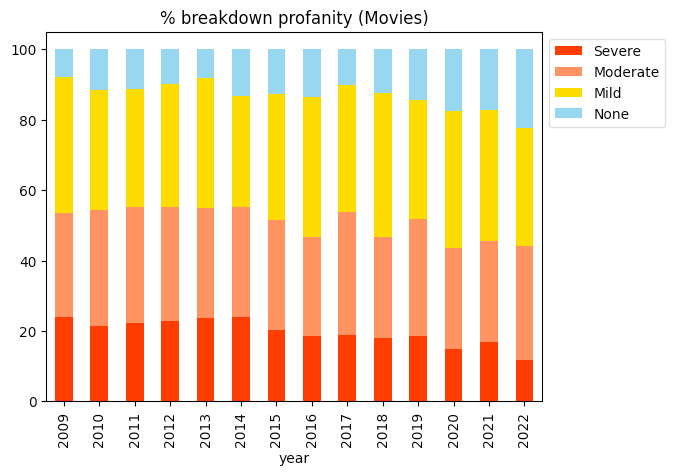
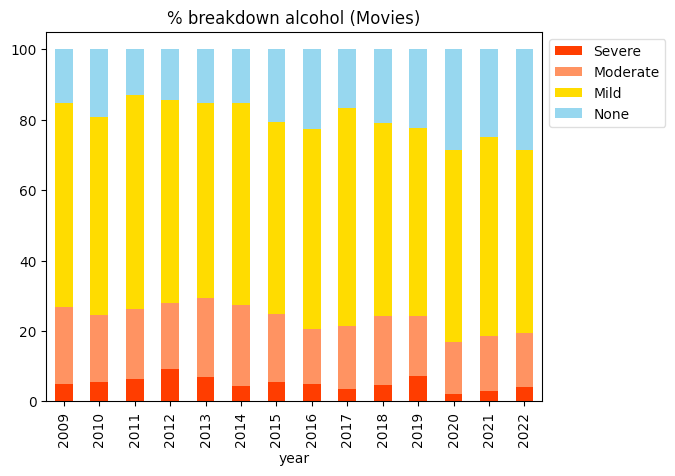
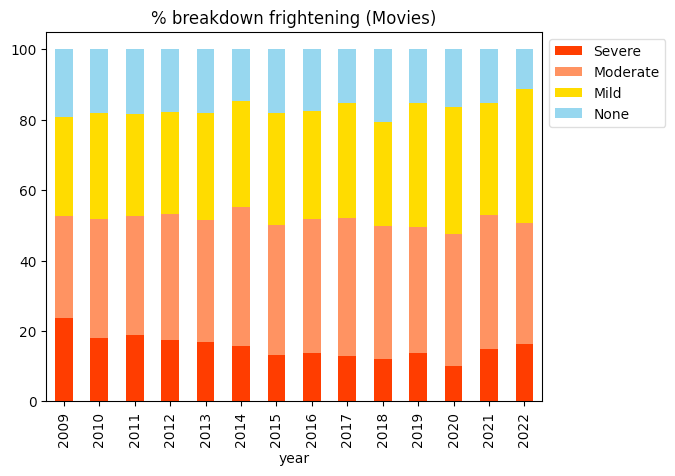
This was TV shows, but what about movies?
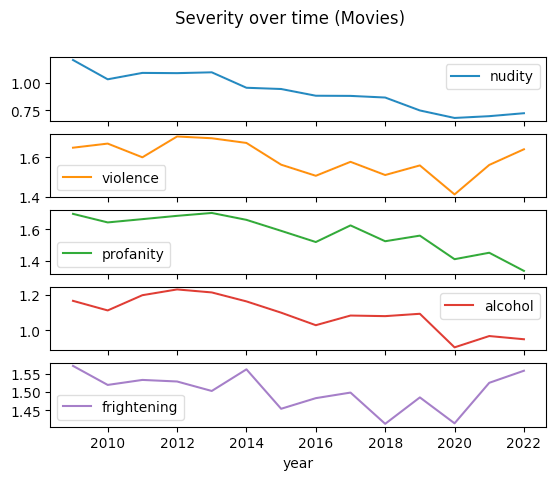
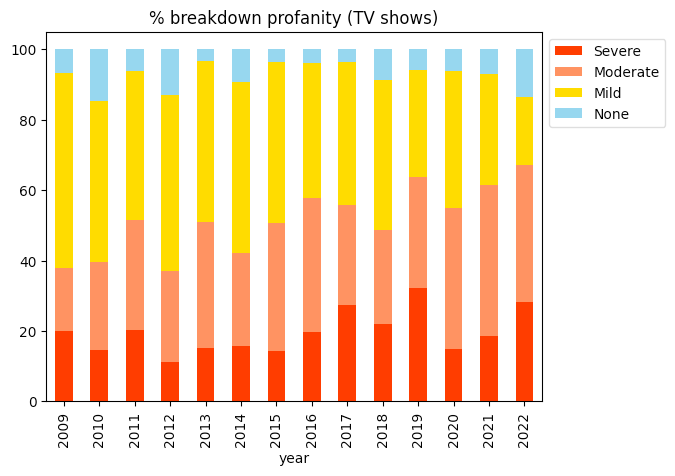
Interesting trends here too — the severity of Nudity and Profanity have been falling.
I’d like to take this analysis further back in time. I wouldn’t be surprised if there are spikes in nudity and violence, probably caused by some influential movie that, uh, inspired other filmmakers.
One problem is that advisory ratings aren’t included in the IMDB dataset and have to be scraped, and I don’t want to get my IP blocked by indiscriminate scraping. So maybe I’ll continue this some other day.
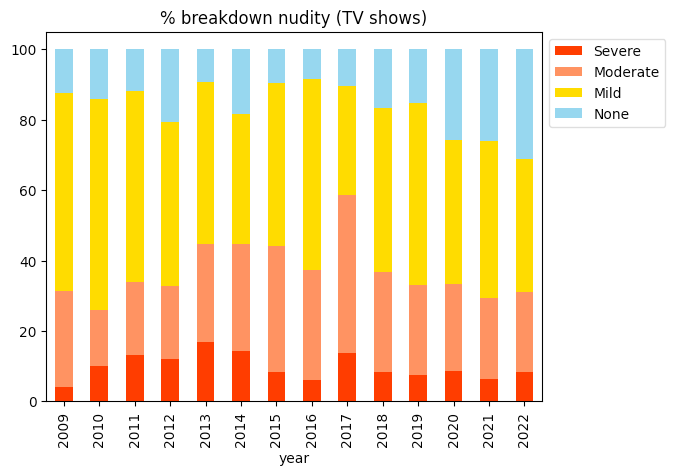
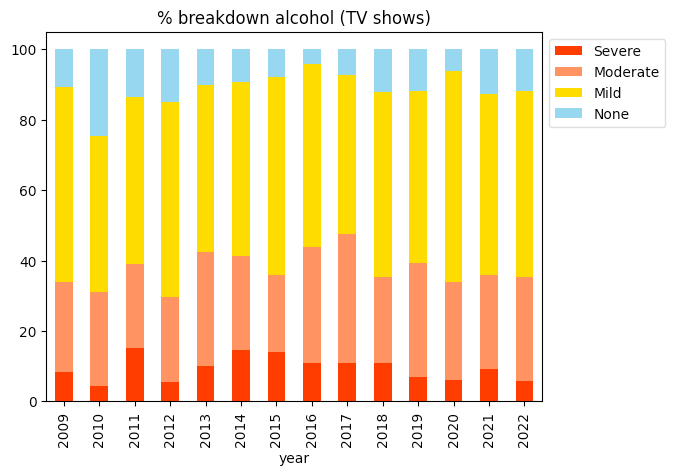
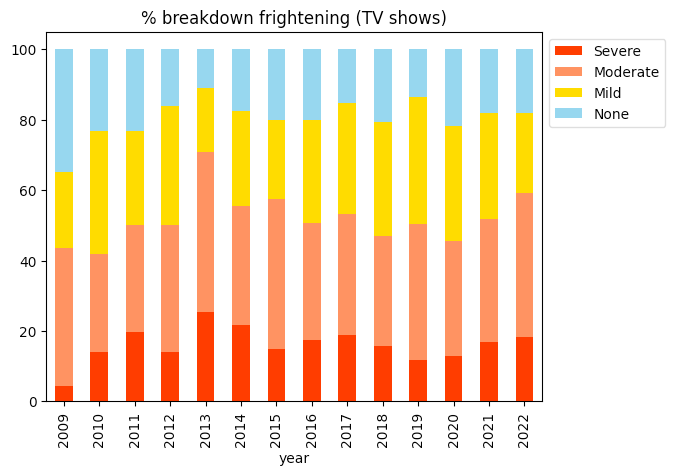
Some more graphs
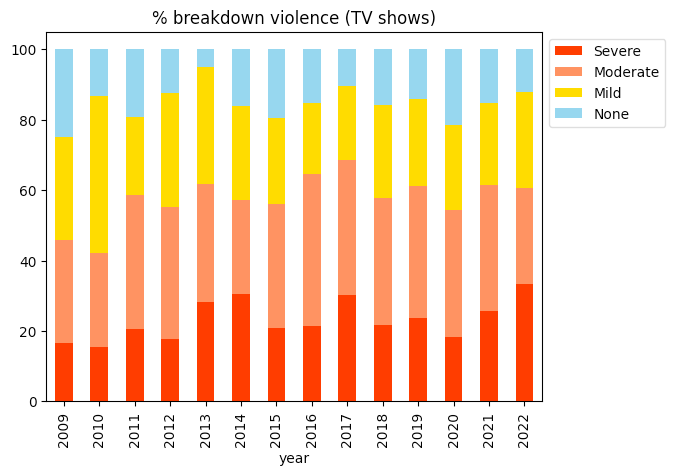
Caveats:
- TV Shows usually run for multiple years, I’ve associated the severity with the start year. So if you see a fall in 2016, there were still other shows running which started in say, 2013. It’s possible to get advisory ratings by individual episodes, but data is lacking since it depends on user input on IMDB.
- Since Advisory data are user-generated, it’s subjective and not based on hard criteria like MPAA ratings.
- The y-axis for the line charts are different for each category, this helps exaggerate the trends, but you shouldn’t draw a relative comparison across categories from them.
- I can’t say if Game of Thrones caused the rise in nudity, but it sure as hell makes a nice clickbaity title.